In the development and construction of the third generation mobile communication, the location and layout of the base station directly affects the service quality of the entire system. Therefore, according to the appropriate propagation model and path loss, the coverage radius of the base station can be calculated.
In the past calculation of base station coverage radius, the typical propagation model is the Hata urban propagation model. The Hata model is expressed as (1):
Hata City Transport Model:
L=46.3+33.9log(f)-13.82log(Hb)+(44.9-6.55log(Hb))log(d)+Cm ......(1)
Where L is the maximum path loss (db);
f is the carrier frequency (Hz);
Hb is the antenna height (m);
d is the distance to the base station (m).
When the sparseness of trees in medium-sized cities or suburban centers is medium: Cm=0
Metropolitan downtown: Cm=3.
For 3G systems, a model is also recommended for 3G organizations. The propagation model is as follows:
3G transmission model:
L=40(1-O.004Hb)log(d)-18log(Hb)+21log(f)+80 ......(2)
Among them, the meaning of each parameter is the same as (1). In WCDMA, when f = 2000MHz, the above two equations are simplified as:
Hata City Communication Model:
L=161.17-13.82log(Hb)-(44.9-6.55log(Hb))log(d);
3G propagation model:
L = 149.32-18 log (Hb) - 40 (1-0.004 Hb) log (d).
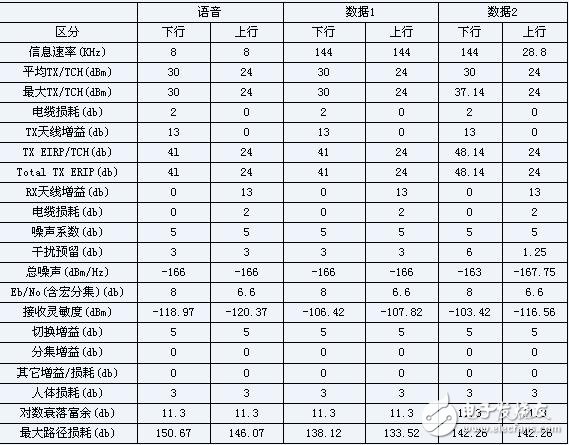
When considering the construction of the third generation mobile communication system, especially the planning and layout of the base station, the coverage of the 3G base station in different environments must first be considered. According to the recommendations of the ITU specifications, the coverage radius is usually calculated using an algorithm of uplink and downlink balance. Due to the diversity of 3G services for different reasons, different services have different performance requirements, and the requirements for coverage are different. The path propagation loss of the 3G system needs to be concluded by the test network, but currently it is mainly estimated based on the propagation model. A typical 3G service uplink and downlink calculation table is given in Table 1. If the antenna gain of the base station is larger than this, the maximum allowable path loss is larger, and the cable loss is also related to the selected model and length.
Table 1 Typical 3G service uplink and downlink balance calculation table

In this way, the maximum path loss value in the propagation model for each service case can be obtained, as shown in Table 2.
Table 2 Unit: dB
![]()
According to the propagation model formula and the data in Tables 1 and 2, we obtain the coverage radius corresponding to different propagation models at different antenna heights (see Table 3).
table 3

It can be seen from the results in Table 3 that the coverage radii corresponding to the two propagation models are quite different. In most coverage calculations, for urban coverage, since the antennas are generally erected on higher buildings, the height is mostly more than 20 meters. In addition, considering that the downlink traffic is higher than the uplink traffic in actual applications, in the initial stage of 3G system construction, the coverage of service types can be considered according to the calculation result of “data 2â€, that is, the coverage radius of the urban base station can be 3.0Km. about.
In the above estimation, we did not take into account the penetration loss. In the general simulation calculation, the penetration loss is roughly 20db. Table 4 shows the coverage radius of the 3G base station considering the penetration loss. The value is About 1.5Km.

Thermal Printer ,Thermal Label Printer,Thermal Receipt Printer,Bluetooth Thermal Printer
ShengXiaoBang(GZ) Material Union Technology Co.Ltd , https://www.sxbgz.com