Performance diagnostics for Linux in 60,000 milliseconds
When you log in to a Linux server to solve a performance problem: What should you check in the first minute?
At Netflix, we have a huge EC2 Linux cloud and a wealth of performance analysis tools to monitor and diagnose its performance. These include Atlas for cloud monitoring and Vector for on-demand instance analysis. While these tools can help us solve most problems, we sometimes still need to log in to a server instance and run some standard Linux performance tools.
In this article, the Netflix Performance Engineering team will walk you through the first 60 seconds of doing the best performance analysis on the command line, using standard Linux tools you should have.
First sixty seconds: overview
By running the following ten commands, you can get a rough idea of ​​the processes and resource usage of the system running in sixty seconds. By looking at the error messages and resource saturations that these commands output (they are easy to understand), you can then optimize your resources. Saturation refers to the load of a resource beyond what it can handle. Once saturated, it is usually exposed in the length or wait time of the request queue.
Uptime
Dmesg | tail
Vmstat 1
Mpstat -P ALL 1
Pidstat 1
Iostat -xz 1
Free -m
Sar -n DEV 1
Sar -n TCP, ETCP 1
Top
Some of these commands require a pre-installed sysstat package. The information presented by these commands can help you implement the USE method (a method for locating performance bottlenecks), such as checking the usage, saturation, and error information of various resources (such as CPU, memory, disk, etc.). In addition, in the process of locating the problem, you can use these commands to eliminate some of the possibility of causing the problem, help you narrow down the scope of the inspection, and point the way for the next inspection.
The following sections will briefly introduce these commands by executing these commands on a production environment as an example. For more information on how to use these tools, please refer to their man documentation.
Uptime

This is a quick way to see the average load on the system, showing how many tasks (processes) to run in the system. On Linux systems, these numbers include processes that need to run in the CPU and processes that are waiting for I/O (usually disk I/O). It's just a rough indication of the system load, just look at it. You also need other tools to learn more about the situation.
These three figures show the results of an average exponential compression of the system's total load in one minute, five minutes, and fifteen minutes. From this we can see how the load of the system changes over time. For example, if you are checking a problem and then see that the value corresponding to 1 minute is much less than the value of 15 minutes, it may indicate that the problem has passed and you have not observed it in time.
In the above example, the system load increased over time because the load value of the last minute exceeded 30, while the average load of 15 minutes was only 19. This significant gap contains a lot of meaning, such as CPU load. For further confirmation, run the vmstat or mpstat commands, which are described in sections 3 and 4 below.
2. dmesg | tail
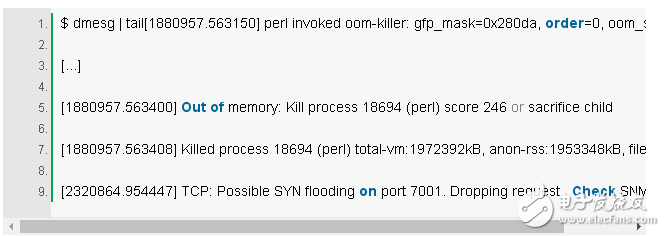
This command explicitly displays the last 10 system messages if they exist. Look for errors that can cause performance problems. The above example contains an oom-killer, and TCP drops a request.
Don't miss this step! The dmesg command is always worth a try.
3. vmstat 1
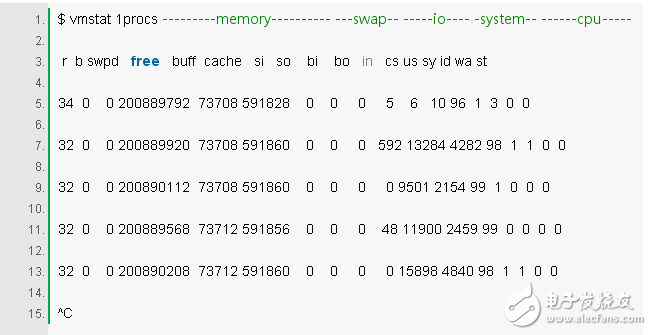
Vmstat(8) is short for virtual memory statistics, a common tool (created for BSD decades ago). It prints a statistical summary of a key server on each line.
The vmstat command specifies a parameter 1 run to print a statistical summary of each second. The columns in the first row of the output of this version (vmstat) are explicitly the average since boot, not the value of the previous second. Now we skip the first line unless you want to understand and remember each column.
Check these columns:
r: The number of processes in the CPU that are running and waiting to run. It provides a better signal than the average load to determine if the CPU is saturated because it does not contain I/O. Explanation: The value of "r" is greater than the number of CPUs, indicating that it is saturated.
Free: Explicit free memory in kb. If the number of digits is large, you have enough free memory. The "free -m" command is the seventh command below, which better describes the state of free memory.
Si, so: Swap-ins and swap-outs. If they are not zero, it means your memory is not enough.
Us, sy, id, wa, st: These are average CPU decomposition times for all CPUs. They are user time, system time (system), idle, waiting for I/O (wait), and time (stolen) (by other visitors, or using Xen, visitors themselves) Drive domain).
The CPU decomposition time will confirm whether the CPU is busy by user time plus system time. Waiting for I/O for the same time indicates a disk bottleneck; this is the CPU idle because the tasks are blocking waiting for the pending disk I/O. You can treat wait I/O as another form of CPU idle, which gives a clue as to why the CPU is idle.
System time is important for I/O processing. An average system time of more than 20% can be worth exploring further: perhaps the kernel is too inefficient when dealing with I/O.
In the above example, CPU time is almost entirely at the user level, indicating that the application is taking up too much CPU time. The average CPU usage is also above 90%. This is not necessarily a problem; check the saturation in the "r" column.
4. mpstat -P ALL 1
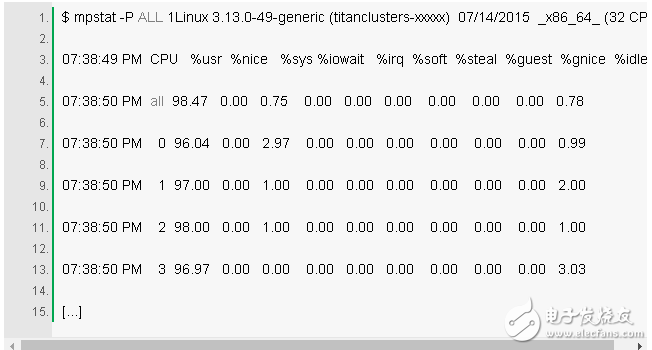
This command prints the CPU decomposition time for each CPU, which can be used to check for an unbalanced usage. A busy CPU is a busy application that represents a single-threaded application.
5. pidstat 1
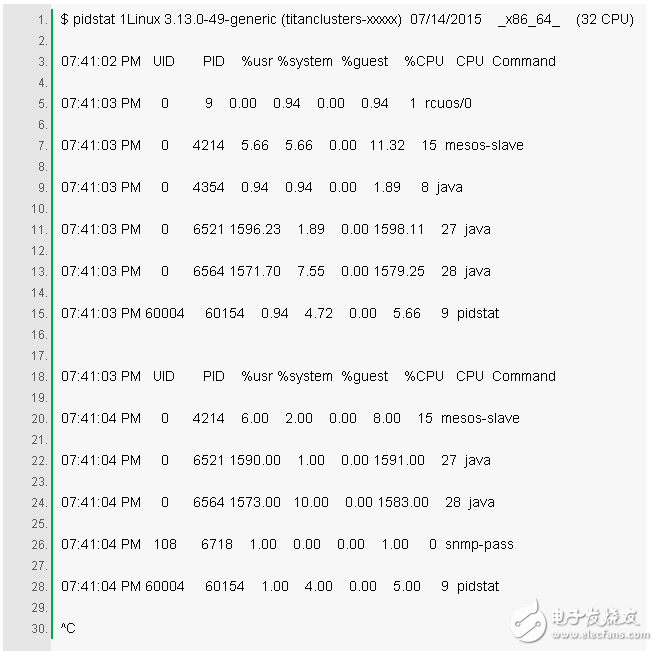
The pidstat command is a bit like the top command for a statistical summary of each process, but loops through a scrolling statistical summary instead of the top brush. It can be used for real-time viewing, as well as copying and pasting what you see into your survey record.
The above example shows that two Java processes are consuming CPU. %CPU This column is the sum of all CPUs; 1591% means that this Java process consumes nearly 16 CPUs.
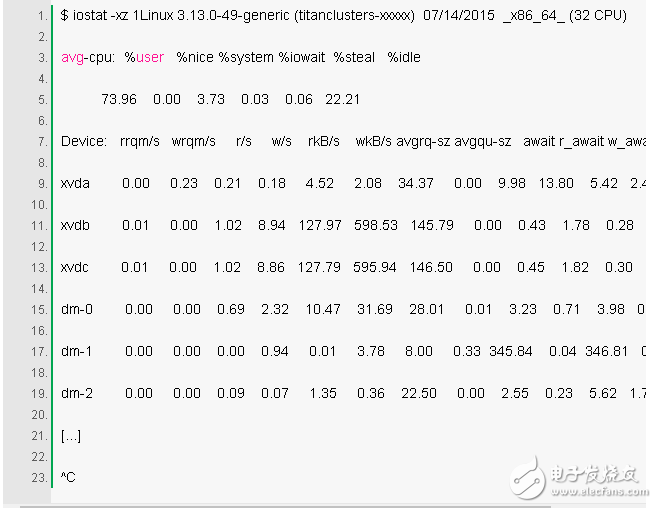
This is a great tool for viewing block device (disk) conditions, both for workload and performance. View the columns:
r/s, w/s, rkB/s, wkB/s: These represent the number of reads, writes, kb reads, and kb writes per second for the device. These are used to describe the workload. Performance issues may simply be due to the application of excessive loads.
Await: The average elapsed time of I/O in milliseconds. This is the actual time consumed by the application because it includes queuing time and processing time. A larger average time than expected may mean saturation of the device or a problem with the device.
Avgqu-sz: The average number of requests made to the device. A value greater than 1 indicates that it is saturated (although devices can process requests in parallel, especially virtual devices consisting of multiple disks.)
%util: Device utilization. This value is a percentage that shows that the device is busy every second while it is working. A value greater than 60% usually indicates poor performance (as can be seen from await), although it depends on the device itself. A value close to 100% usually means saturated.
If the storage device is a logical disk device for many back-end disks, 100% utilization may simply mean that some I/O usage is currently being processed, however, the back-end disk may be far less saturated and may be able to handle more More work.
Keep in mind that poor disk I/O performance is not necessarily a problem with the program. Many techniques are typically asynchronous I/O, so that applications are not blocked and subject to delays (eg, read-ahead, and write buffering).
7. free -m
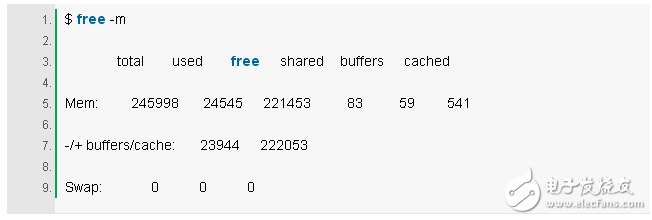
The two columns on the right are explicit:
Buffers: Buffer cache for block device I/O.
Cached: The page cache for the file system.
We just want to check for sizes that are not close to zero, which can result in higher disk I/O (confirmed with iostat), and worse performance. The above example looks good, and each column has a lot of M sizes.
The memory usage provided by -/+ buffers/cache is more accurate than the first line. Linux uses memory that is temporarily unused as a cache and reassigns it as soon as the application needs it. So some of the memory used as cache is actually idle memory. To explain this, some people even built a website: linuxatemyram.
This can be even more confusing if you have ZFS installed on Linux, because ZFS's own file system cache does not count as free -m. Sometimes it is found that there is not much free memory available in the system, but the memory is still in the ZFS cache.
8. sar -n DEV 1
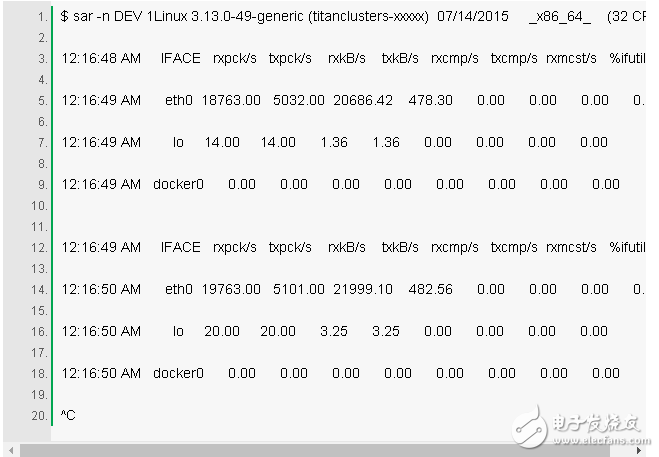
This tool can be used to check the throughput of the network interface: rxkB/s and txkB/s, and whether the limit is reached. In the above example, the traffic received by eth0 reaches 22 Mbytes/s, which is 176 Mbits/sec (the limit is 1 Gbit/sec).
%ifutil is also provided as a metric for device usage (maximum received and sent) in our version. We can also measure this value using Brendan's nicstat tool. As with nicstat, the value displayed by sar is difficult to obtain accurately. In this case, it is not working properly (0.00).
9. sar -n TCP, ETCP 1
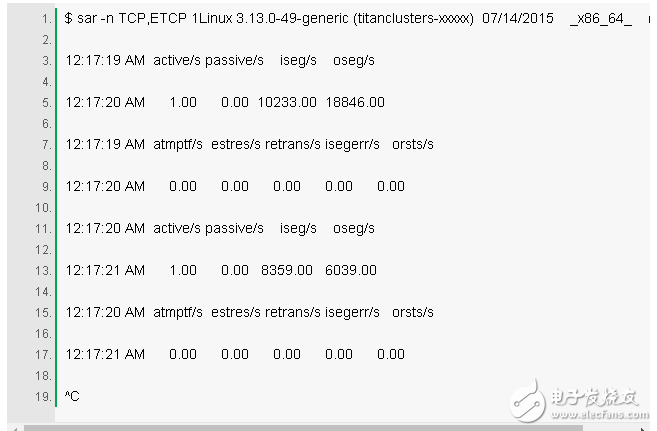
This is a summary view of some of the key TCP metrics. These include:
Active/s: The number of locally initiated TCP connections per second (for example, via connect()).
Passive/s: The number of TCP connections initiated remotely per second (for example, via accept()).
Retrans/s: The number of retransmissions of TCP per second.
The number of active and passive connections is often useful for describing a rough measure of server load: the number of newly accepted connections (passive) and the number of downstream connections (active). It can be understood that the active connection is external, and the passive connection is internal, although strictly not exactly correct (for example, a localhost to localhost connection).
Retransmission is a sign of a network and server problem. It may be caused by an unreliable network (for example, the public network), or it may be due to server overload and packet loss. The above example shows that there is only one new TCP connection per second.
10. top
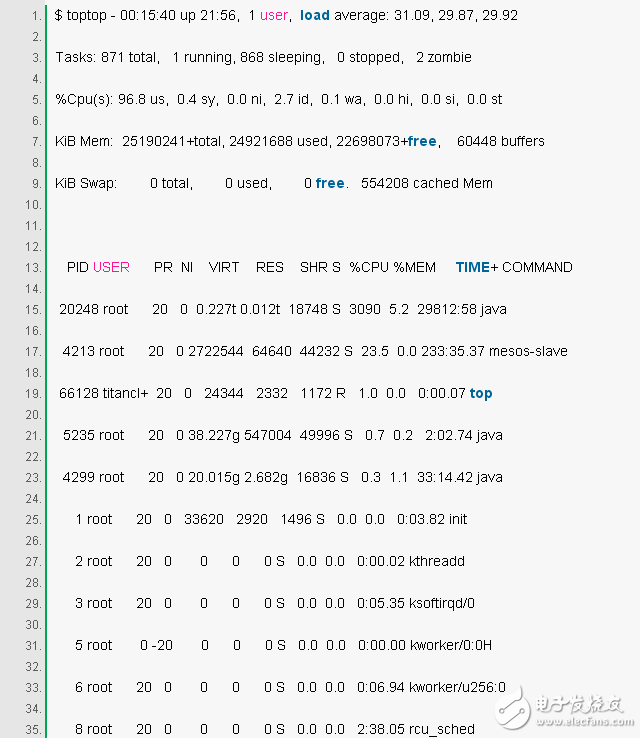
The top command contains a lot of metrics that we have checked before. It can be easily executed to see a big difference in the output compared to the previous command, which indicates that the load is variable.
One disadvantage of top is that it is difficult to see the trend of data changing over time. The scrolling output provided by vmstat and pidstat will be clearer. If you don't pause the output fast enough (Ctrl-S pauses, Ctrl-Q continues), some clues to intermittent problems may also be lost due to being cleared.
Subsequent analysis
There are more commands and methods that can be used for more in-depth analysis. Check out Brendan's Linux Performance Tools tutorial at Velocity 2015, which includes more than 40 commands covering observability, benchmarking, tuning, static performance tuning, analysis, and tracking.
Absolute rotary Encoder measure actual position by generating unique digital codes or bits (instead of pulses) that represent the encoder`s actual position. Single turn absolute encoders output codes that are repeated every full revolution and do not output data to indicate how many revolutions have been made. Multi-turn absolute encoders output a unique code for each shaft position through every rotation, up to 4096 revolutions. Unlike incremental encoders, absolute encoders will retain correct position even if power fails without homing at startup.
Absolute Encoder,Through Hollow Encoder,Absolute Encoder 13 Bit,14 Bit Optical Rotary Encoder
Jilin Lander Intelligent Technology Co., Ltd , https://www.jilinlandertech.com